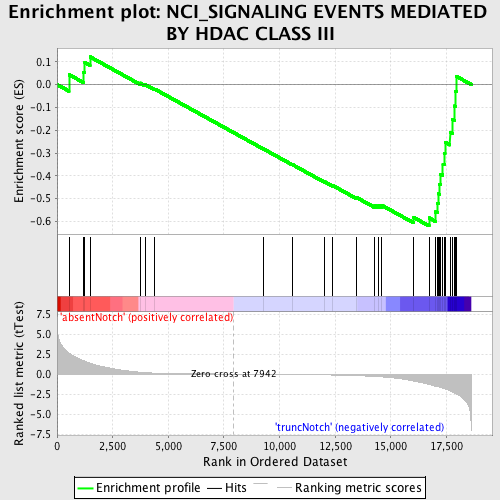
Profile of the Running ES Score & Positions of GeneSet Members on the Rank Ordered List
| Dataset | Set_03_absentNotch_versus_truncNotch.phenotype_absentNotch_versus_truncNotch.cls #absentNotch_versus_truncNotch.phenotype_absentNotch_versus_truncNotch.cls #absentNotch_versus_truncNotch_repos |
| Phenotype | phenotype_absentNotch_versus_truncNotch.cls#absentNotch_versus_truncNotch_repos |
| Upregulated in class | truncNotch |
| GeneSet | NCI_SIGNALING EVENTS MEDIATED BY HDAC CLASS III |
| Enrichment Score (ES) | -0.6197031 |
| Normalized Enrichment Score (NES) | -1.4265537 |
| Nominal p-value | 0.04 |
| FDR q-value | 0.54812545 |
| FWER p-Value | 1.0 |
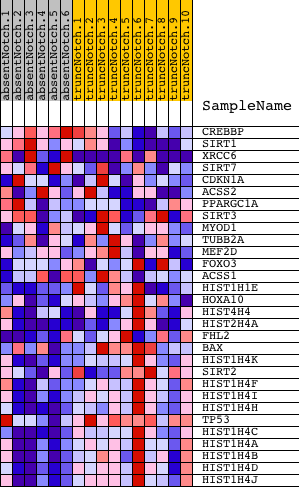
| PROBE | DESCRIPTION (from dataset) | GENE SYMBOL | GENE_TITLE | RANK IN GENE LIST | RANK METRIC SCORE | RUNNING ES | CORE ENRICHMENT | |
|---|---|---|---|---|---|---|---|---|
| 1 | CREBBP | 5690035 7040050 | 535 | 2.625 | 0.0437 | No | ||
| 2 | SIRT1 | 1190731 | 1190 | 1.676 | 0.0548 | No | ||
| 3 | XRCC6 | 2850450 3870528 | 1246 | 1.614 | 0.0964 | No | ||
| 4 | SIRT7 | 5890632 | 1481 | 1.365 | 0.1215 | No | ||
| 5 | CDKN1A | 4050088 6400706 | 3730 | 0.231 | 0.0069 | No | ||
| 6 | ACSS2 | 1780435 3170224 | 3966 | 0.185 | -0.0006 | No | ||
| 7 | PPARGC1A | 4670040 | 4383 | 0.125 | -0.0195 | No | ||
| 8 | SIRT3 | 4010440 6040431 | 9272 | -0.022 | -0.2819 | No | ||
| 9 | MYOD1 | 1230731 | 10568 | -0.049 | -0.3502 | No | ||
| 10 | TUBB2A | 6940435 | 12010 | -0.093 | -0.4252 | No | ||
| 11 | MEF2D | 5690576 | 12385 | -0.112 | -0.4422 | No | ||
| 12 | FOXO3 | 2510484 4480451 | 13441 | -0.186 | -0.4938 | No | ||
| 13 | ACSS1 | 6580037 | 14282 | -0.294 | -0.5309 | No | ||
| 14 | HIST1H1E | 6980706 | 14458 | -0.324 | -0.5314 | No | ||
| 15 | HOXA10 | 6110397 7100458 | 14575 | -0.345 | -0.5281 | No | ||
| 16 | HIST4H4 | 5900142 | 16030 | -0.861 | -0.5826 | No | ||
| 17 | HIST2H4A | 4670372 | 16721 | -1.280 | -0.5844 | Yes | ||
| 18 | FHL2 | 1400008 | 17004 | -1.500 | -0.5581 | Yes | ||
| 19 | BAX | 3830008 | 17093 | -1.555 | -0.5199 | Yes | ||
| 20 | HIST1H4K | 4570735 | 17154 | -1.595 | -0.4791 | Yes | ||
| 21 | SIRT2 | 630494 | 17193 | -1.629 | -0.4362 | Yes | ||
| 22 | HIST1H4F | 1090504 | 17244 | -1.675 | -0.3926 | Yes | ||
| 23 | HIST1H4I | 2190450 | 17344 | -1.760 | -0.3493 | Yes | ||
| 24 | HIST1H4H | 4060446 | 17400 | -1.816 | -0.3022 | Yes | ||
| 25 | TP53 | 6130707 | 17437 | -1.852 | -0.2530 | Yes | ||
| 26 | HIST1H4C | 5570528 | 17659 | -2.061 | -0.2080 | Yes | ||
| 27 | HIST1H4A | 1940600 | 17766 | -2.198 | -0.1530 | Yes | ||
| 28 | HIST1H4B | 4210524 | 17856 | -2.317 | -0.0938 | Yes | ||
| 29 | HIST1H4D | 3520398 | 17909 | -2.406 | -0.0301 | Yes | ||
| 30 | HIST1H4J | 4060348 | 17947 | -2.467 | 0.0360 | Yes |